Introduction
In this blog, I want to talk about how to leverage az cli to visualize a graph in Python. Note that Azure portal has a tab that shows the visualization of the resources. The reason why I am still interested in this topic is that I want to turn azure resource definition into a data structure, which can then be leveraged to generate different form of diagrams:
- dependency graph of azure resources
- data flow diagram (for threat modeling)
- mermaid diagram (for documentation)
- sequence diagram (need to get sequence information from users)
There are also other tools for visualizing azure resources:
Parser
At first, I want to build my own parsing library using open source library like chevrotain. I can build a lexer and a grammar and then turn azure resource definition file into AST (abstract syntax tree).
But hey, there’s already an official library: arm-template-parser. Do not reinvent the wheel!
The parser is a cli tool. I download the executables and it is named Template.Parser.Cli.
This is how you invoke the program:
$sourcePath = "./example-template.json"
$parametersSourcePath = "./example-template.param.json"

.\Template.Parser.Cli.exe -s $sourcePath -f $parametersSourcePath -a
Note:
sourcePath: the azure resource templateparametersSourcePath: the parameters-ais to show all resources, otherwise, the cli only returns one resource
I use subprocess to execute the program:
# .env
az_tool_exe_path="C:/Users/huijinghuang/source/hacks/Template.Parser.Cli.exe"

# command.py
import subprocess
from typing import List

def run(args: List[str]):
    """Run a command with the given arguments and return the result.

    The returned object:
    - result.stdout contains the output of the command execution.
    - result.stderr contains the error of the command execution

    Example:
    run(["ls", "-l"])
    # Output:
    # total 8

    Args:
        args (List[str]): List of command and arguments

    Returns:
        CompletedProcess: The result of the command execution

    Raises:
        subprocess.CalledProcessError: If the command execution fails
    """
    try:
        result = subprocess.run(
            args,
            check=True,
            capture_output=True,
            text=True)
        return result
    except subprocess.CalledProcessError as e:
        print(f"Execiton Error: {e}")

# main.py
def execute():
    # Run the azure cli command to parse the azure sources definition
    exe_path = settings.az_tool_exe_path
    params = ["-s", source_template_filepath, "-f", parameters_filepath, "-a"]
    args = [exe_path] + params
    result = run(args)
    resources = json.loads(result.stdout)
Visualization
Once I have the compiled azure resources file, I then build a dependency graph. I use networkx for building graph and matplotlib for displyaing the result.
def create_graph(resources: Dict[str, Any]):
    """
    Create a dependency graph from the resources.

    Args:
        resources (Dict[str, Any]): The resources definition in json format
    """
    # Create a directed graph
    G = nx.DiGraph()

    names = []
    # Add nodes
    for resource in resources:
        name = resource.get("name")
        names.append(name)
        G.add_node(name)

    # Add edges
    for resource in resources:
        src = resource.get("name")
        depends = resource.get("dependsOn", [])
        for dependency in depends:
            # Find the correct name in the names list that matches the suffix
            dst = next((name for name in names if dependency.endswith(name)), None)
            assert dst is not None, f"Resource {dependency} not found"
            G.add_edge(src, dst)

    return G
Once I have the graph, I then call matplotlib to show the graph:
# Draw the graph
nx.draw(G, with_labels=True)
plt.show()
Here’s an example output:
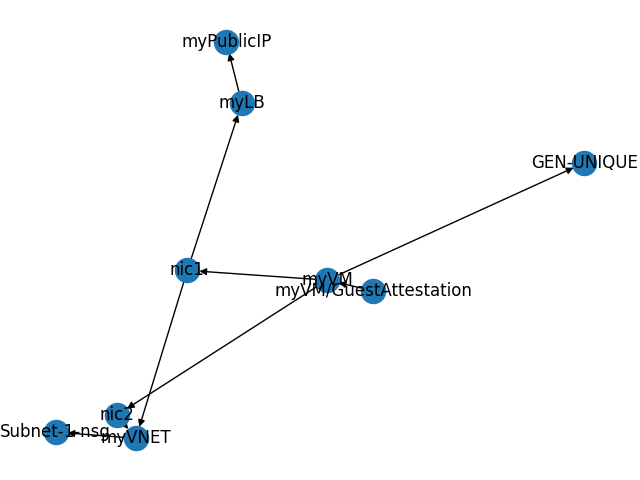
This graph looks ugly.
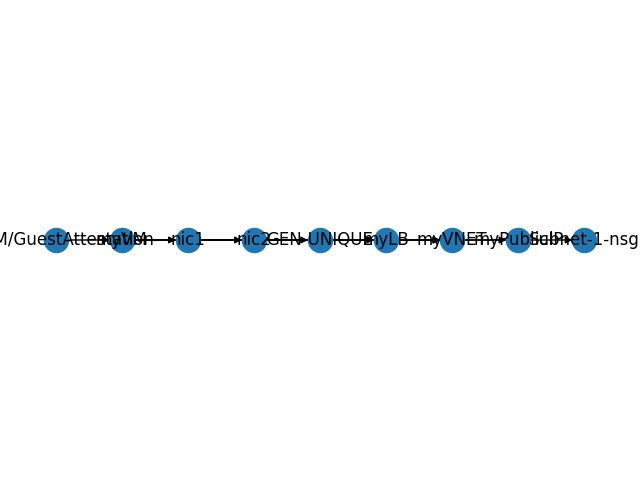
I want to apply topological sort the graph:
# Apply a topological sort to the graph
sorted_nodes = list(nx.topological_sort(G))

# Create a position dictionary based on the topological sort order
pos = {node: (i, 0) for i, node in enumerate(sorted_nodes)}

# Draw the graph with the custom positions
nx.draw(G, pos, with_labels=True)
plt.show()
The order is now great, but, it is now linear:
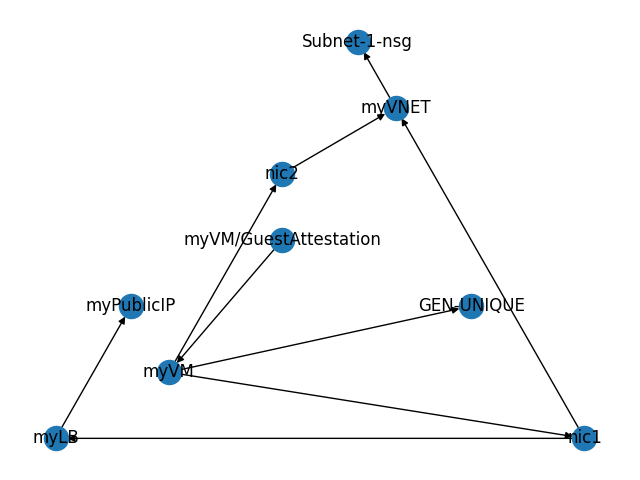
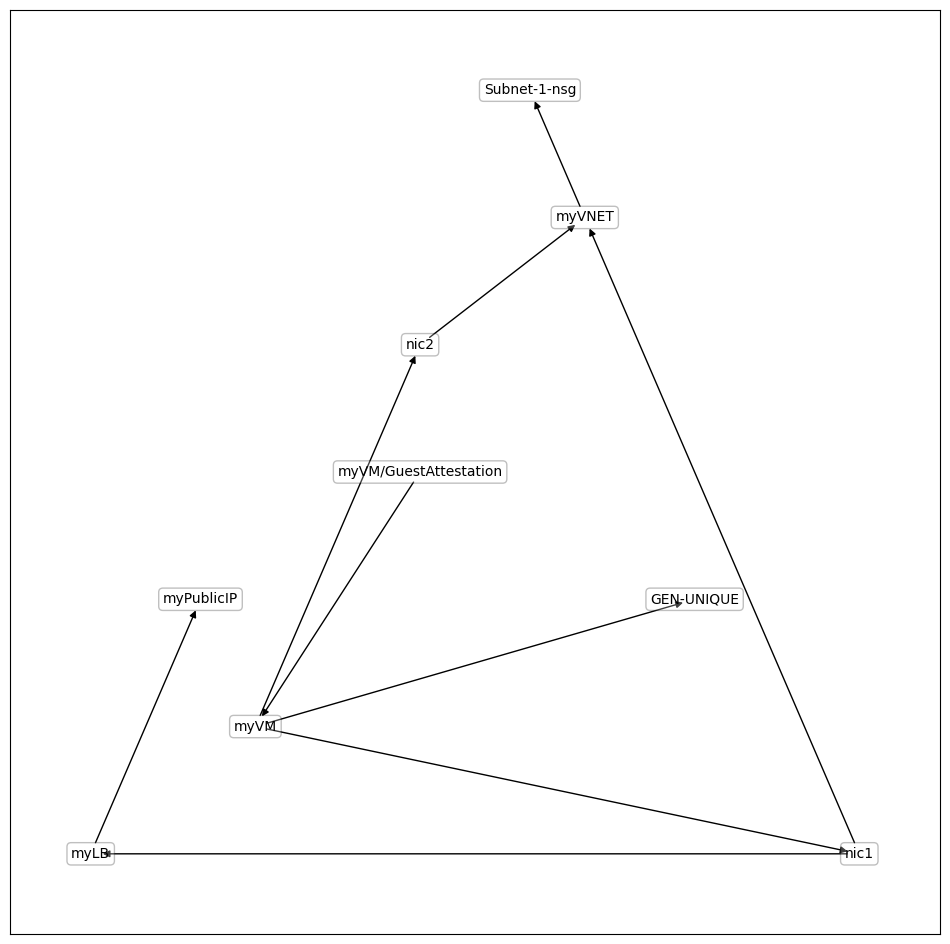
Well, the best I can do so far is to use the planner layout:
pos = nx.planar_layout(G)
nx.draw(G, pos, with_labels=True)
plt.show()
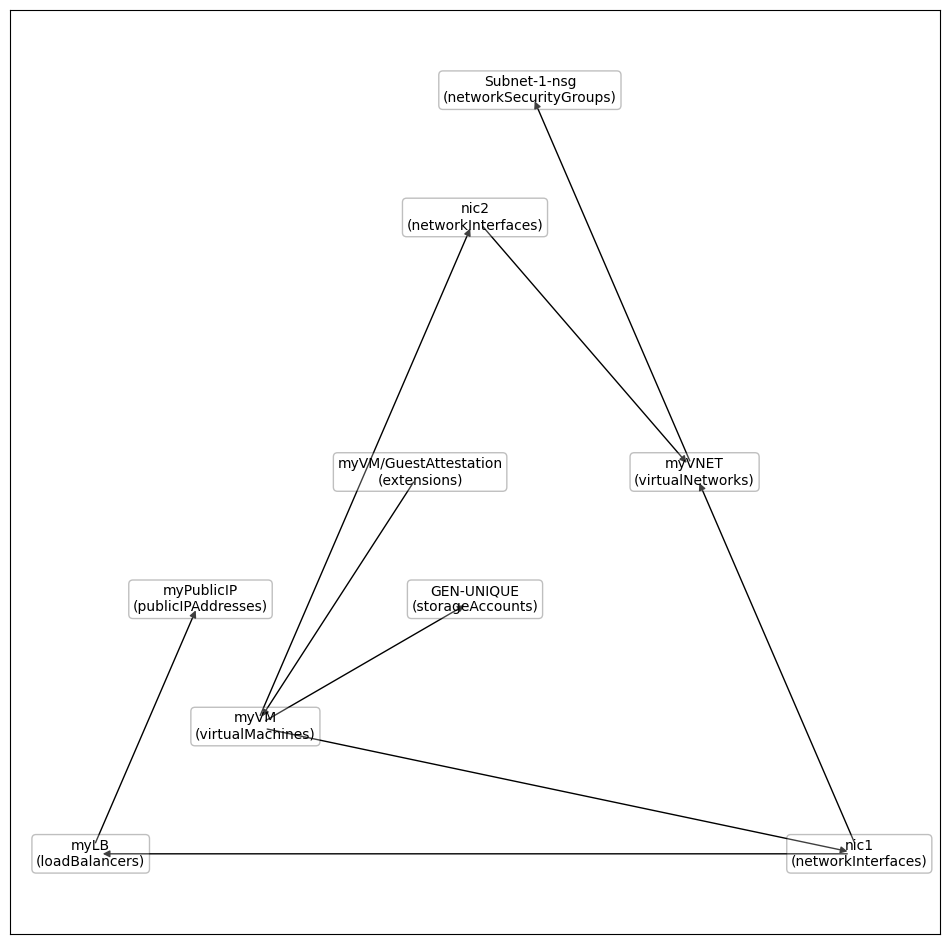
I then made the following adjustment to the images:
- get rid of node color
- draw box around labels
- make the labels transparent
- increase the image size
def save_graph_image(G, file_path):
    plt.figure(figsize=(12, 12))  # Increase figure size to prevent cutting off text and shapes

    pos = nx.planar_layout(G)

    # Draw nodes with custom settings
    nx.draw_networkx_nodes(G, pos, node_size=3000, node_color="none", node_shape="s")

    # Draw labels with bounding box to fit text within nodes
    nx.draw_networkx_labels(G, pos, font_size=10, bbox=dict(facecolor='white', alpha=0.25, edgecolor='black', boxstyle='round,pad=0.3'))

    # Draw edges
    nx.draw_networkx_edges(G, pos, arrowstyle='-|>', arrowsize=10)

    plt.savefig(file_path, bbox_inches='tight')  # Save the figure with tight bounding box
    plt.close()
I also enhance the diagram with a name_type mapping information.
# Create custom labels with both name and type
# Since the type is too verbose, I am going to only display the last part
# For example:
# Microsoft.Network/virtualNetworks => virtualNetworks
name_type_sim = {name: type.split("/")[-1] for name, type in name_type.items()}
labels = {node: f"{node}\n({name_type_sim[node]})" for node in G.nodes()}

# ...
# Draw labels with bounding box to fit text within nodes
nx.draw_networkx_labels(G, pos, labels=labels, font_size=10, bbox=dict(facecolor='white', alpha=0.25, edgecolor='black', boxstyle='round,pad=0.3'))