Geneva is an internal monitoring platform developed by Microsoft.
While Geneva is widely used within Microsoft, it is not publicly available.
However, Microsoft offers similar monitoring tools for external customers, such as Azure Monitor.
Recently, I have been working on a feature to implement infrastructure for sending metrics using Geneva APIs.
In this blog, I’ll share a high-level overview of what I have learned.
Source Code
I cannot talk too much about the infrastructure setup here, as those are internal implementations.
Essentially, you can build some common functionality so that in the source code, you can define new metrics with dimensions in the following way:
{ "ApiLatencyMetrics", new[] { "Name", "Machine" } },
Note that we only define two dimensions here: Name and Machine. The value itself is not a dimension!
When we run a script, it automatically creates a new class called ApiLatencyMetrics.cs and registers it in the Geneva namespace.
We also have a centralized metricsClient that allows us to send metrics to the backend:
this.metricClient.SendMetric("ApiLatencyMetrics", 2000, "api1", "vm1");
this.metricClient.SendMetric("ApiLatencyMetrics", 1500, "api1", "vm1");
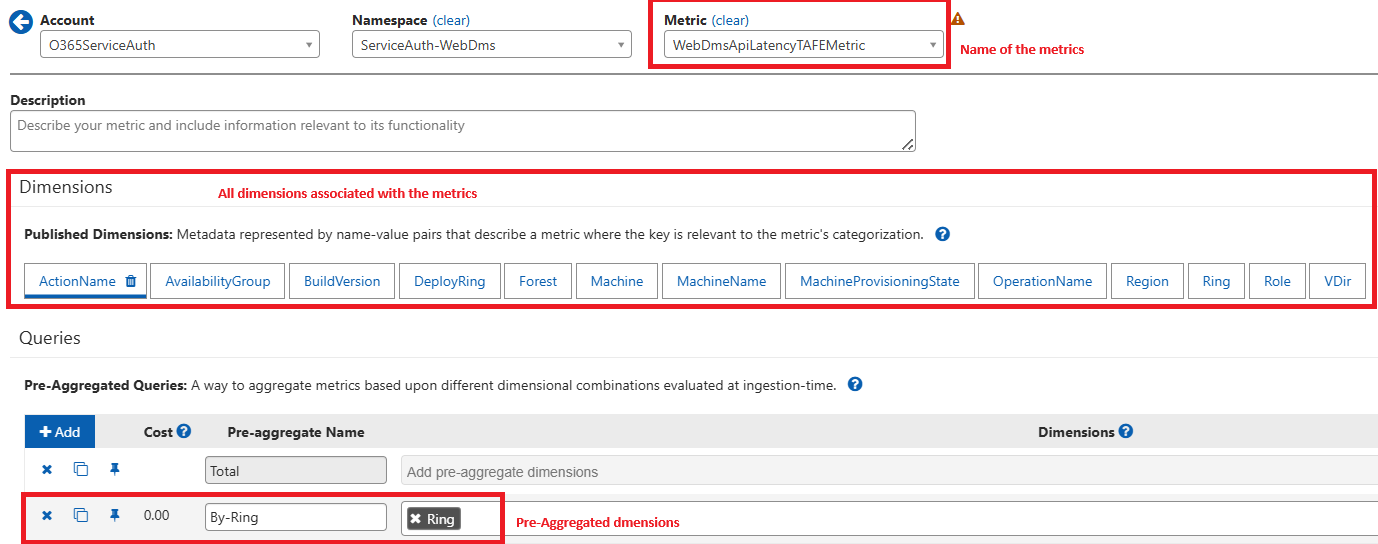
Dimensions
Once the changes are deployed to production, it’s important to understand the concept of dimensions.
Let’s say we trigger the API 5 times, and we want to track the latency for different APIs:
| ID | Name (str) | Machine (str) | Latency (double) |
|---|---|---|---|
| 1 | api1 | vm1 | 2000 |
| 2 | api2 | vm1 | 3000 |
| 3 | api1 | vm1 | 1500 |
| 4 | api1 | vm2 | 2000 |
| 5 | api2 | vm2 | 2000 |
These records are appended to the backend as-is.
We then need to create aggregation queries. You can add yours in the dashboard:
Here’s how to understand the aggregation:
Total = 2000 + 3000 + 1500 + 2000 + 2000 = 10500
The Total metric is available by default. I imagine that whenever a new data point arrives, the counter simply increases by that amount.
The same applies to other dimensions.
For example, if we configure a new dimension called By-name and add Name as the dimension, we will have:
| IDs | Name | Latency |
|---|---|---|
| [1, 3, 4] | api1 | 5500 |
| [2, 5] | api2 | 5000 |
You can even aggregate with all dimensions: By-name-machine by adding both dimensions. This will result in:
| IDs | Key | Latency |
|---|---|---|
| [1, 3] | [api1, vm1] | 3500 |
| [4] | [api1, vm2] | 2000 |
| [2] | [api2, vm1] | 3000 |
| [5] | [api2, vm2] | 2000 |
Visualization
The visualization part is quite straightforward, so I won’t go into all the details here.
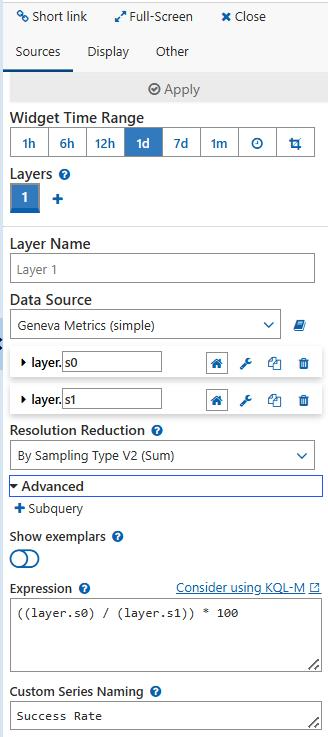
I want to highlight that there’s an expression option that allows you to calculate metrics like the success rate.
For instance, consider the following table:
| ID | Name (str) | Result (str) | Latency (double) |
|---|---|---|---|
| 1 | api1 | success | 2000 |
| 2 | api2 | failure | 3000 |
| 3 | api1 | success | 1500 |
| 4 | api1 | failure | 2000 |
| 5 | api2 | success | 2000 |
You have a Count metric that calculates how many API calls are successful:
| IDs | Result | Count |
|---|---|---|
| [1, 3, 5] | success | 3 |
| [2, 4] | failure | 2 |
You can place this metric in the layer s0:

You can add another metric that counts the total number of requests: Total = 5.
Then, you can use an expression to calculate the success rate:
Donut Chart
Another challenge I faced was that the data structure expected by the Geneva dashboard is different from Kusto Query!
To provide some context, the Geneva dashboard also allows you to fetch data from a Kusto cluster instead of the Geneva workspace.
In Kusto, I had a working query that returned a list of API calls and their counts. The table looked like this:
| APIs | Count |
|---|---|
| api1 | 7 |
| api2 | 212 |
| api3 | 20 |
| api4 | 6 |
| api5 | 11 |
I could render a donut chart using: render piechart.
However, when I ported this Kusto query to Geneva, I encountered an error indicating that it was trying to aggregate all data points into one.
Instead of a proper pie chart, I got a chart with a single data point:
- Value: 51.2
- Percentage: 100%
It seemed Geneva was calculating the average value of these data points!
After reading a bunch of documentation, I realized Geneva expects a different data format.
I needed to write a Kusto query that returned data in the following format:
| api1 | api2 | api3 | api4 | api5 |
|---|---|---|---|---|
| 7 | 212 | 20 | 6 | 11 |
This allowed me to render a proper pie chart (or donut chart) in the Geneva dashboard.